
Introduction
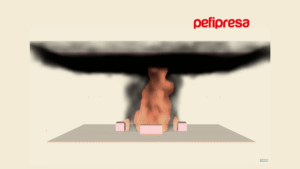
In fire simulations using CFD (e.g., FDS), it is common to represent fire using a curve of heat release rate (HRR) as a function of time. However, choosing such a curve is not always straightforward, especially when seeking to realistically reflect fire spread to adjacent objects and the effect of water suppression.
This article summarizes a study to define fire curves based on experimental tests (NIST) and explains how these curves can be applied, along with ignition and extinction parameters in FDS, to consistently predict fire evolution.
Heat release rate curves adjusted to tests
Individual test (Test 25)
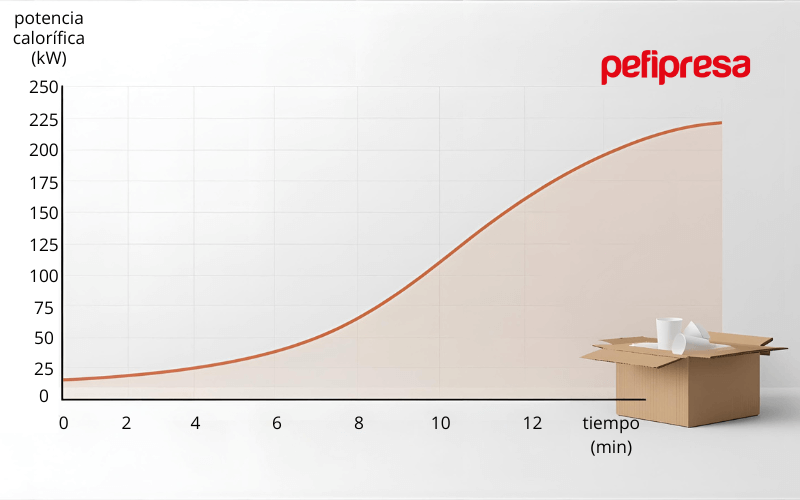
This involves a cardboard box with polystyrene cups, where the HRR curve grows and decays characteristically.
- With a burner surface and a curve (RAMP) defined by points, the representation is straightforward: the fire initiates and grows as in the test.
- To simulate it with a real box (which doesn’t burn instantly but upon exceeding its ignition temperature), it was necessary to adjust parameters such as IGNITION_TEMPERATURE (~350 °C) and HRRPUA (~625 kW/m²). This allowed reproducing the experimental curve.
Multiple tests (Tests 26, 27 and 28)
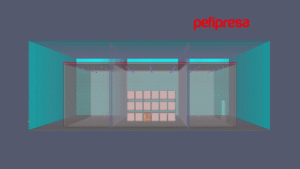
The box is repeated in different configurations (2, 4 or 8 boxes). Even with a maximum HRR per box, the total power is not a simple sum, as there are faces of adjacent boxes that do not burn completely.
FDS allows reflecting the propagation through temperature ignition in each cell, respecting the defined individual curve and the actual arrangement of the boxes. This methodology is particularly useful in performance-based design studies where modeling accuracy is required.
Effect of water suppression
Once the heat release rate of each object (box) has been defined, sprinkler suppression can be introduced. There are two main modes in FDS:
Extinction coefficient (E)
- Based on tests such as those by Madrzykowski & Vettori, Evans or Yu, Lee & Kung, which propose an exponential decay relationship of the HRR curve after water discharge.
- The E factor (in m²/(kg·s)) depends on the water density (l/min·m²) and the material class (e.g., Group A plastics).
To better understand the theoretical foundations of suppression, it is recommended to consult the SFPE Handbook of Fire Protection Engineering, an international reference in fire protection engineering.

Extinction temperature
- An EXTINCTION_TEMPERATURE value is specified below which the fire stops sustaining.
- It is a simple and “automatic” method in FDS, although less detailed than the extinction coefficient.
These approaches allow estimating how heat release rate will decay as a function of applied water density and combustible material characteristics.
Main conclusions
Consistent and scalable curves
From an experimental test of a simple fuel load (e.g., cardboard box with polystyrene), a realistic fire curve can be defined that, combined with ignition temperature, predicts propagation to similar objects in different configurations.
Ignition and extinction parameters
- Adjusting IGNITION_TEMPERATURE and HRRPUA allows reflecting the fire initiation and growth phase.
- Including an extinction coefficient or an extinction temperature in FDS reproduces the fire decay phase when water is discharged.
Applicability in performance-based studies
These criteria help refine fire models in performance-based engineering projects, incorporating real laboratory data and considering control or suppression effects.
To learn more
The complete article details the parameters and equations of each test, as well as validations and bibliographic references (SFPE Handbook, NIST Technical Notes, etc.). For those wishing to delve deeper into fire simulation with CFD models and the definition of curves from tests, it is recommended to consult:
- NIST Technical Note 2102, “Heat Release Rates of Multiple Transient Combustibles”
- SFPE Handbook of Fire Protection Engineering (chapter 26: “Heat Release Rates”)
In conclusion, modeling fire from experimental data and adjusting water suppression through appropriate coefficients or cutoff temperatures can notably improve the fidelity of simulations. This approach provides a more solid framework for design decisions and performance-based evaluation in fire protection engineering.