Introduction
In the field of fire engineering, the extinction coefficient (E_COEFFICIENT) plays a key role in adequately simulating the cooling and extinguishing action of automatic sprinklers when discharged water is included in computational fluid dynamics (CFD) tools, such as FDS, and the fire curve is not defined “a priori” but rather the fire propagates by ignition temperature.
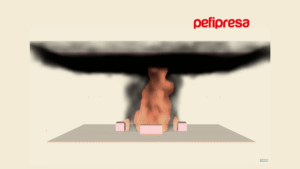
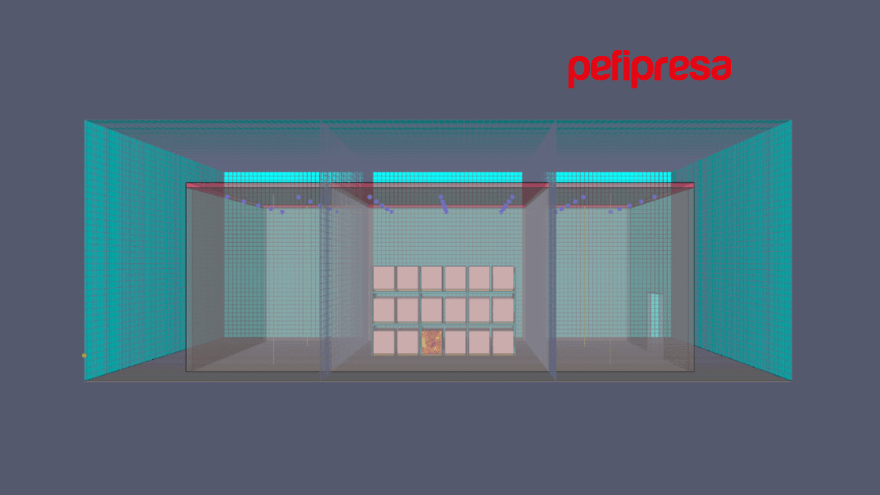
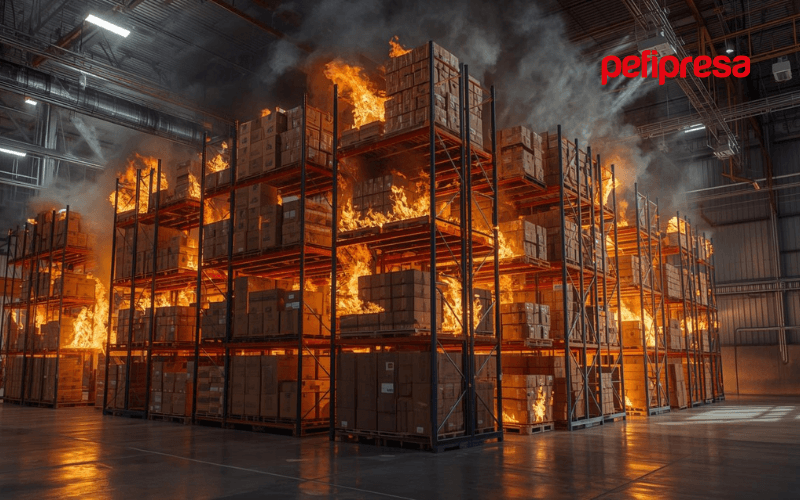
In this article, a continuation of the one published as Part 1, simulations are compared with real fire tests (FM Global) in 3 and 5-tier rack storage, classified as “Class II” (cardboard boxes on wooden pallets).
Additionally, the accuracy of FDS versus a two-zone model (CFAST) is also compared to evaluate fire behavior in storage scenarios with sprinkler protection.
The objective is to demonstrate the validity of incorporating the extinction coefficient in 3D modeling, and how this approximates the fire evolution to real results: obtaining the same maximum heat release rate (in MW), the same number of activated sprinklers, and a fire curve with growth, control, and extinction phases very similar to the tests.
Modeling the fire curve with sprinklers and discharged water
Why use an extinction coefficient?
The extinction coefficient (E) modifies the heat release rate of the fire as a function of the water density reaching the combustible surface. Classic studies by Yu, Lee, and Kung demonstrate how water application can reduce the energy released during the combustion process in high-density storage.
Key concept: The extinction coefficient allows simulating the interaction between water discharged by sprinklers and the burning surface, faithfully reproducing the power reduction observed in real tests.
Scenario characteristics and densities
The tests were conducted at FM Global facilities for 3 and 5-tier storage with K160 sprinklers (1.31 bar pressure, 183 L/min per sprinkler, equivalent to 20 mm/min). In real tests without water, maximum powers of 25 MW (3 tiers) and 47 MW (5 tiers) were reached, while with sprinkler contribution the values were reduced to 4 MW and 13 MW, respectively.
In FDS simulations, fire propagation was introduced by ignition temperature (350 °C), assigning a unit heat release rate per unit area according to the commodity (250 kW/m² for Class II). And the extinction coefficient was included based on the actual exposed surface area of the load.
Results comparison
Effect of ventilation and boundary conditions
Three different configurations were simulated to evaluate the impact of boundary conditions on fire evolution:
- Nearly enclosed space (only one entrance door).
- Perimeter curtain 1 m below the ceiling (partial smoke exhaust).
- Without restrictions (total opening for smoke exhaust).
The results show that the greater the smoke extraction, the lower the heat accumulation in the enclosure and fewer sprinklers are activated. With very enclosed spaces, the power curve presents higher peaks and more sprinklers are activated. The best correlations with real tests are obtained by allowing uniform smoke exhaust, as occurred at FM (large enclosure with upper exhaust).
Importance of ventilation: The configuration of openings and smoke evacuation systems directly influences the ambient temperature of the enclosure, affecting the number of sprinklers that activate and the evolution of fire power.
Adjustment with 3 and 5-tier tests
The comparison between simulations and experimental tests yields remarkably accurate results:
- Without water, the simulation reached ~22-25 MW for 3 tiers and ~52 MW for 5 tiers, correlating well with the test curve (25 MW and 47 MW).
- With water, the simulation yielded ~6 MW (3 tiers) and ~15 MW (5 tiers), also very close to real tests (4 MW and 13 MW).
- Number of activated sprinklers: in the case of 5 tiers, FDS predicted 15 open sprinklers, and in experiments there were 13 and 15 in two different tests.
These results demonstrate that CFD modeling with calibrated extinction coefficient reproduces with high fidelity both the maximum power reached and the number of activated devices, validating its applicability in fire protection engineering projects.
Limitations of the two-zone model (CFAST)
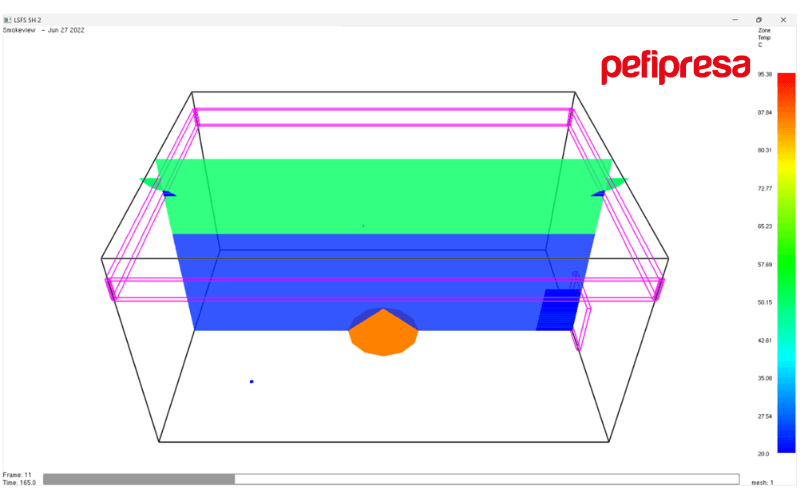
To contrast the accuracy of three-dimensional modeling, CFAST was used applying suppression with water density on the floor area. In high storage risks, the two-zone model presents significant limitations:
- After the first sprinkler, the fire drops abruptly, without following the additional growth phase observed in reality.
- Maximum powers of 1-3 MW are obtained, much lower than the 14 MW measured in experimental tests.
This shows that CFAST oversimplifies the progressive action of multiple sprinklers, underestimating the power of high-tier fires. FDS, on the other hand, with a surface extinction coefficient and fire modeling by surface propagation in 3D, does reflect the real behavior of combustion and extinction.
Zone model limitations: Simplified models like CFAST are useful for preliminary evaluations in ordinary hazard scenarios, but do not adequately capture the complexity of sprinkler suppression in high-tier storage where vertical propagation is critical.
Conclusions
- Reliability of extinction coefficient: Applying the Yu, Lee, Kung values for the storage category and water density (20 mm/min) allows replicating with remarkable accuracy the fire curve (power vs. time) and the number of activated sprinklers.
- Influence of ventilation: A very enclosed space tends to elevate power and the number of activated sprinklers. Allowing smoke exhaust (as in FM tests) produces an almost identical correlation to real tests.
- Two-zone model: It is useful for low or ordinary hazard scenarios, but does not capture realistic growth or suppression in high-tier fires or complex storage.
- Practical applications: These results can be extrapolated to performance-based design of large warehouses, justifying the use of the extinction coefficient with FDS to demonstrate the effectiveness of automatic sprinkler systems.
In summary, CFD simulations with water and extinction coefficient, calibrated for commodity category, are configured as a reliable tool to forecast the control and extinction of fires in 3 and 5-tier racks, reinforcing the validity of this approach versus large-scale tests.
Summarized bibliography
- “Validation of extinction coefficient when modeling fire with automatic sprinklers — Part 1”, 2024.
- Yu, Lee, Kung (1994). Suppression of Rack-Storage Fires by Water.
- Ren et al. (2017). “Large-Scale Fire Suppression Modeling of Corrugated Cardboard Boxes on Wood Pallets…” FM Global.
- Madrzykowski & Vettori (1992). A Sprinkler Fire Suppression Algorithm for the GSA Engineering Fire Assessment System. NISTIR 4833.
- Evans (1993). Sprinkler Fire Suppression Algorithm for HAZARD. NISTIR 5254.
- UNE EN 12845 (2021). Fixed firefighting systems – Automatic sprinkler systems.
- FM 8-9 (2022). Storage of Class 1, 2, 3, 4 and Plastic Commodities.